In the week or so where the Internet was going through its ‘ best *insert literally any word here* of 2013’ phase, I jumped on the bandwagon and wrote a post about the best-received stories of the year gone by on the interhacktives website.
*Interhacktives is the website the students on the Interactive Journalism MA at City University London.
Essentially the post was borne out of a growing desperation to keep the site updated during a slow couple of weeks where work experience and the badly needed Christmas holidays put writing for interhacktives on the back burner for a while.
At the same, this quick analysis of the type of articles that do well for the website offered valuable insight in refining our content strategy and provide added focus for the year ahead.
After Adam Tinworth, our lecturer for the Social Media and Community Engagement module, pointed to what we could learn from analysing this type of data, I thought it was worth delving into the analytics a little further to find some more meaning in the metrics.
The most-read post published on interhacktives – by some distance – was an article on the top ten tools for data journalism. Not only did it receive more pageviews, but equally as important was the fact that readers spent around two and a half times longer (7 mins and 25 seconds) on that post than is the average for all pages on the site (2 minutes and 56 seconds).
This is a great example of a type of article that can live through time and keep getting pageviews months after initial publication.
As data driven journalism becomes more popular in the industry and as upcoming journalists join media professionals in trying to stay up to date with the skillset needed to do some basic-level data analysis and visualisation, the article’s prominence is no surprise.

Google Analytics showing pageviews over time for the Top 10 Data Journalism Tools
A look at its popularity over the months shows spikes at different times, with new tweets about it from other sources coming after its initial publication also interesting.

Top Ten Data Journalism Tools
Another popular story, the third most viewed story of 2013, was in fact a post written in April 2012 about making a website compliant with EU cookie law. Looking at the source of its traffic over the 13 month-period, more than two out of three views came from Google, as this was a topic that bloggers and others were presumably still searching for. It is in this context that this article’s enduring popularity makes sense.
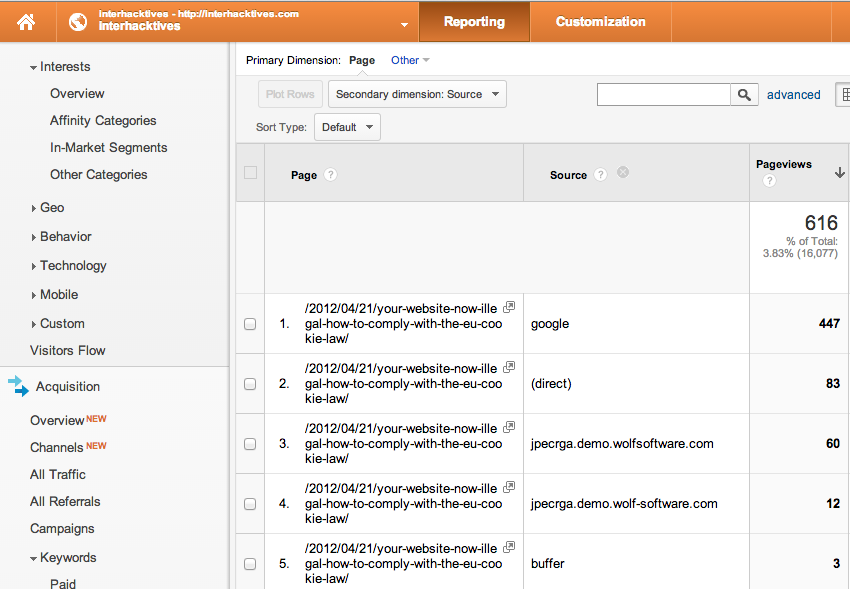
Traffic source data for the third most popular post of 2013 on interhacktives
Two more recent how-to guides to making a choropleth map and using Raw to make advanced data visualisations are regularly generating traffic over the last couple of months, often featuring on the trending content widget on the homepage.
With most interviews for example, they may receive attention at the time, especially via social media, but are unlikely to keep generating traffic to your time in bulk.

Trend over time graph for an interview article
In fact, analysis of the top 10 articles from January 1st 2013 to February 1st 2014 in terms of pageviews shows that the majority are predominantly timeless, durable pieces of content of use to readers beyond their publication date. They are what you would describe as ‘stock content’.
Fellow coursemate Sophie Murray Morris offers an excellent analysis of stock and flow content, a concept originating from economics.
Here’s what she says:
“…stock content is durable. Examples of stock content include podcasts, videos, guides and research work.
Flow content is the stream of daily and sub-daily updates. For instance, news articles, surveys, live blogs and social media updates.
While flow content helps to keep newspapers or brands in the public eye, stock content drives steady and continuous traffic to websites over a long period of time. This is why it is really important not to remove good-quality archived content from a website. Good quality archived content can still drive views in if people are researching the topic, for instance.”
Articles explaining the difference between Sunni and Shia Muslims are a great example of stock content that will likely drive views long after the publication date.

Difference between sunni and shia google search
As the question undoubtedly will crop up regularly across time, any explainers on the issue will regularly attract traffic. The first two search results are from the BBC from 2009 and 2011, while the Economist’s May 2013 guide comes in third. Both websites will certainly get hits on their site regularly from this one-off explainer based on people’s searches.
Perhaps in the media industry content such as explainers, how-to guides and reviews of apps and tools are often perceived to be of secondary importance, to accompany a major development or news piece. That maybe so, but they given the nature of the internet, they can live much longer online than the news article and are a core part of the journalistic task to inform the population.
At interhacktives have perhaps been guilty of not focusing enough on this and the potential the website offers to create long-lasting stock content based on the skills we are regularly taught and experiment with as part of the course.
Over the next few months, that is something we should perhaps turn our attention to a little more and leave a lasting legacy on the interhacktives website, hopefully ensuring traffic for the site many months after our involvement with it ends.
